Dr. Sen showed a Centers for Disease Prevention and Control map of the U.S. that illustrated how the highest rates for both stroke and diabetes corresponded, with the Southeastern region being a focus.
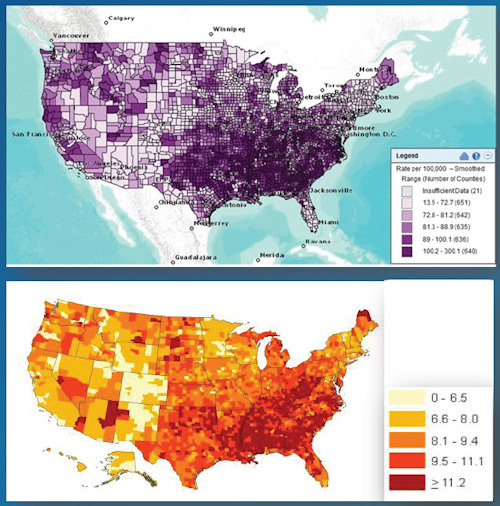
These maps show the rates of diabetes (purple) and stroke (orange) in the U.S. As the presenters noted, the Southeastern region is known as the "stroke belt" and the "diabetes belt." Bottom: 2007 U.S. estimates of diagnosed diabetes among adults age 20 years and older. The maps were created using the Interactive Atlas of Heart Disease and Stroke, a website developed by the CDC Division for Heart Disease and Stroke Prevention.
www.cdc.gov/dhdsp/maps.